Building Production Ready Applications: A Complete Guide to Modern App Architecture
So you've built an amazing application. Your code works perfectly on your local machine, all the features are implemented, and you're ready to share it with the world. But here's the thing: getting your app to work on your laptop is just the beginning. Making it work reliably for thousands or even millions of users in the real world requires an entirely different level of architecture and planning.
Welcome to the world of production ready applications. This is where your code meets reality, where uptime matters, where performance is critical, and where a single bug can affect thousands of users simultaneously. Let's explore the essential components that make modern applications robust, scalable, and maintainable in production environments.
What Does "Production Ready" Actually Mean?
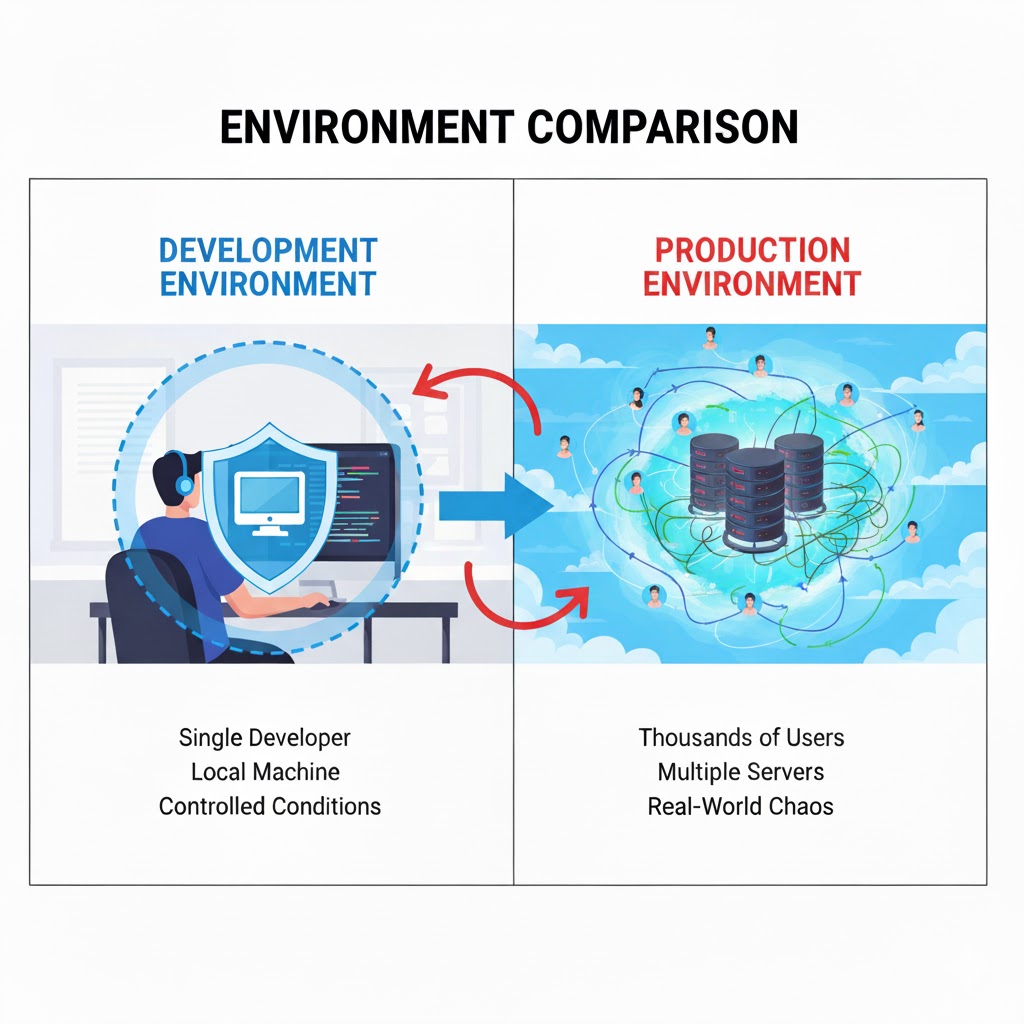
Before we dive into the technical components, let's understand what we mean by "production ready." When developers talk about production, they're referring to the live environment where real users interact with your application. It's the difference between a prototype in your garage and a car on the highway with passengers.
A production ready application needs to handle real-world challenges that don't exist in development:
- Thousands of users accessing it simultaneously
- Users from different parts of the world with varying internet speeds
- Unexpected errors and edge cases you never thought of
- Server failures and network issues
- Security threats and malicious attacks
- The need for updates without disrupting service
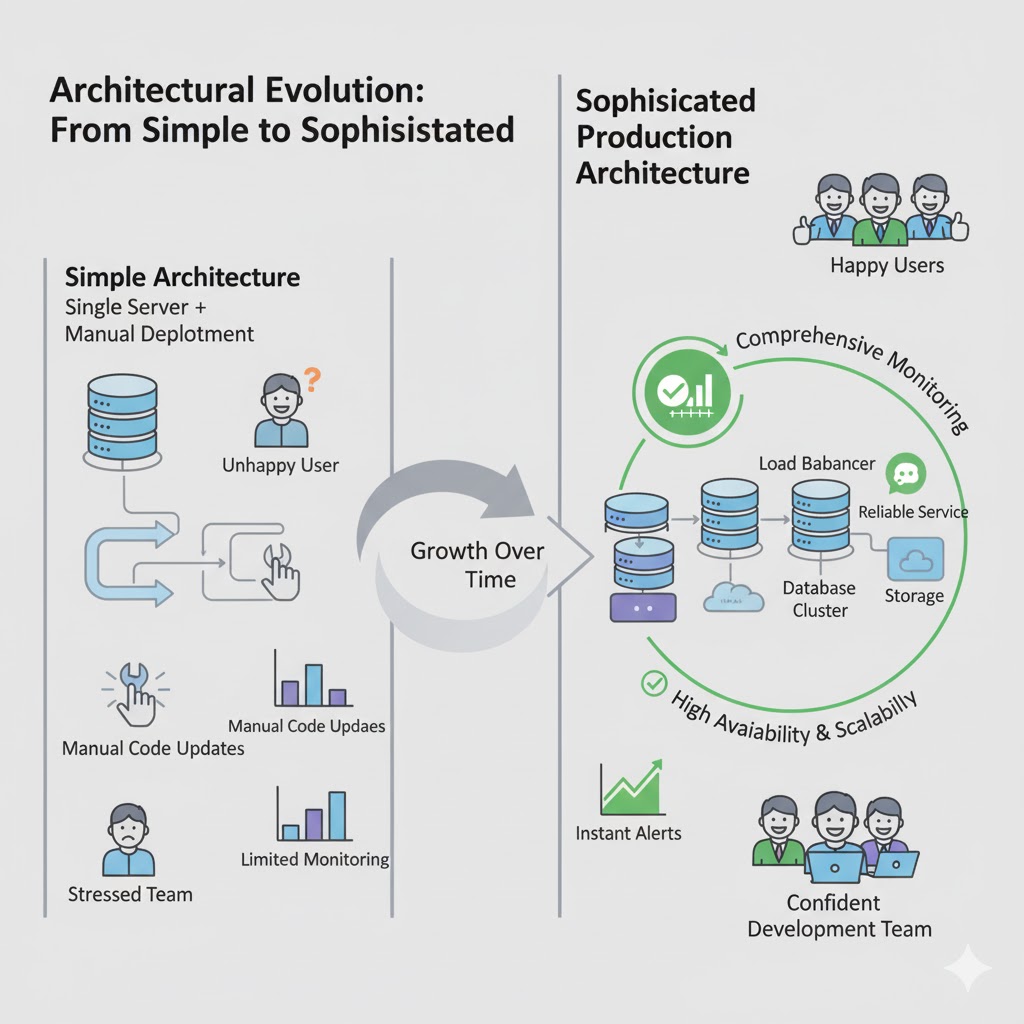
Building for production means creating systems that can handle all of this gracefully while keeping your users happy and your data safe. Let's look at how we accomplish this.
CI/CD Pipeline: Automating the Journey from Code to Production
Let's start with how code actually gets from a developer's computer to the production servers where users can access it. In the early days of software development, this was a manual, error-prone process. Developers would write code, manually copy files to servers, run commands, and hope everything worked. If something broke, they'd scramble to fix it. This approach simply doesn't scale for modern applications.
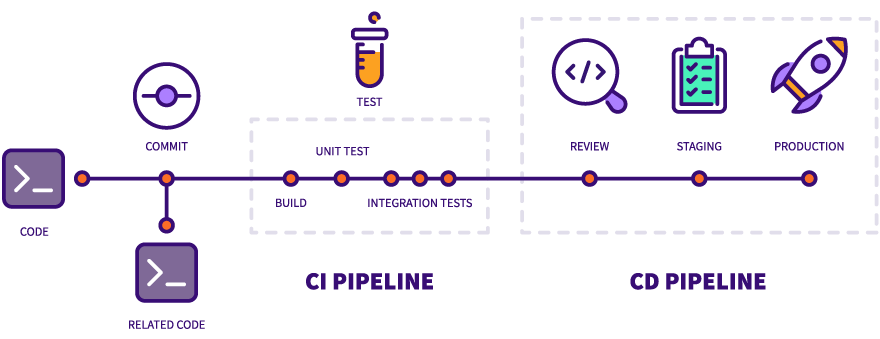
Enter CI/CD: Continuous Integration and Continuous Deployment. These are practices and tools that automate the entire process of getting code from the repository to production servers. Think of it as an assembly line for software, where each stage checks and validates your code before it moves forward.
Continuous Integration (CI): This is the practice of automatically testing and validating code whenever developers make changes. Instead of waiting weeks to integrate everyone's work and discovering conflicts, CI does this constantly throughout the day.
Here's how it works in practice: A developer writes some new code for a feature. They commit this code to the shared repository (like GitHub or GitLab). The moment that code is committed, the CI system springs into action automatically. It pulls the new code, sets up a clean environment, and runs a series of checks.
These checks typically include:
- Building the application: Making sure the code actually compiles and runs
- Running automated tests: Unit tests check individual functions, integration tests verify components work together, and end-to-end tests simulate real user interactions
- Code quality checks: Analyzing the code for common mistakes, security vulnerabilities, and style violations
- Checking dependencies: Making sure all required libraries are available and compatible
If any of these checks fail, the developer is immediately notified. The problematic code never makes it further down the pipeline. This catches bugs early, when they're easiest and cheapest to fix.
Continuous Deployment (CD): Once code passes all the CI checks, the CD system takes over to actually deploy it to production. This happens automatically, without any manual intervention.
The CD pipeline typically involves several stages:
- Staging deployment: The code is first deployed to a staging environment, which is essentially a clone of production but not accessible to real users. This allows for final testing in an environment that closely mimics production.
- Additional verification: Automated tests run against the staging environment to ensure everything works as expected in a production-like setting.
- Production deployment: If everything looks good, the code is automatically deployed to the actual production servers where real users can access it.
- Health checks: After deployment, the system monitors the application to ensure it's running correctly and serving users properly.
The entire process happens without anyone manually logging into servers, copying files, or running commands. This eliminates human error, makes deployments faster and more reliable, and allows teams to deploy changes multiple times per day instead of once every few weeks.
Popular CI/CD Platforms: Teams use various platforms to implement CI/CD pipelines. Jenkins is one of the oldest and most flexible options, offering extensive customization but requiring more setup. GitHub Actions integrates directly with GitHub repositories, making it convenient for projects already hosted there. GitLab CI/CD offers similar integration for GitLab users. Other popular options include CircleCI, Travis CI, and Azure DevOps.
The beauty of CI/CD is that it removes the fear of deploying. Because every change goes through rigorous automated testing and the deployment process is standardized and repeatable, teams can confidently push updates to production knowing that if something goes wrong, the same automated system can quickly roll back to the previous version.
Load Balancers and Reverse Proxies: Handling Traffic at Scale
Now that your application is deployed and running, let's talk about how it actually serves users. Imagine your app suddenly becomes popular. Maybe it gets featured on social media, or a news site writes about it. Suddenly, instead of a few dozen users, you have thousands hitting your servers simultaneously. What happens?
If you only have a single server running your application, it quickly becomes overwhelmed. Requests pile up, response times slow to a crawl, and eventually the server might crash entirely. This is where load balancers and reverse proxies come in, and they're absolute game-changers for production applications.
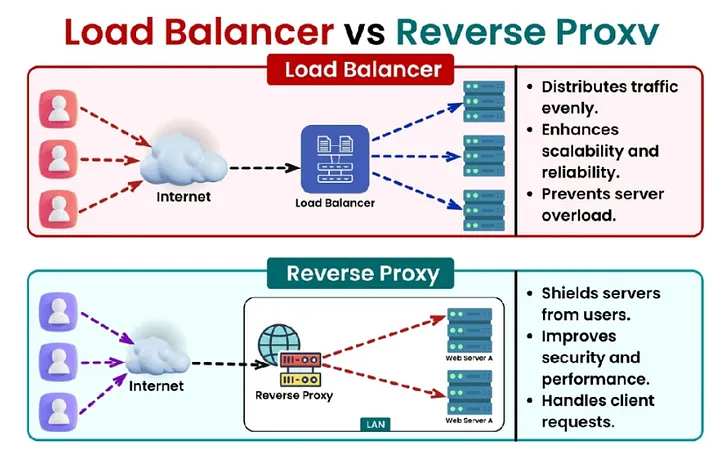
What is a Load Balancer?: A load balancer sits in front of your application servers and distributes incoming user requests across multiple servers. Instead of one server trying to handle everything, you have several servers (often called a "server pool" or "server farm"), and the load balancer decides which server should handle each request.
Think of it like a restaurant host during a busy dinner rush. Customers keep arriving (user requests), and the host (load balancer) decides which server (waiter) should take each table. A good host distributes tables evenly so no single waiter gets overwhelmed while others stand idle.
How Load Balancing Works: When a user tries to access your application, their request first hits the load balancer. The load balancer then selects one of your application servers based on various strategies:
- Round Robin: The simplest approach. The load balancer sends the first request to Server 1, the second to Server 2, the third to Server 3, and so on in a rotating pattern. When it reaches the last server, it starts over.
- Least Connections: More intelligent. The load balancer keeps track of how many active connections each server has and sends new requests to whichever server is currently handling the fewest connections.
- Response Time: Even smarter. The load balancer monitors how quickly each server responds and preferentially sends requests to the fastest servers.
- Geographic: For global applications, the load balancer might route users to the server physically closest to them for better performance.
Benefits of Load Balancing: The advantages go beyond just handling more traffic. Load balancers provide redundancy and reliability. If one server crashes or needs maintenance, the load balancer simply stops sending requests to it and distributes traffic among the remaining healthy servers. Users never notice. This is called "high availability."
Load balancers also make scaling easy. Need to handle more traffic? Just add more servers to the pool, and the load balancer automatically starts including them in the rotation. Need to perform maintenance? Take one server out of the pool, update it, and add it back without any downtime.
Reverse Proxies: The Smart Gateway: Closely related to load balancers are reverse proxies, and in fact, many reverse proxies also function as load balancers. A reverse proxy sits between the internet and your application servers, acting as an intermediary for all requests.
One of the most popular reverse proxies is Nginx (pronounced "engine-x"). While it can distribute requests across multiple servers like a load balancer, it does much more:
- SSL/TLS Termination: Handling encrypted HTTPS connections requires computational work. The reverse proxy can handle all the encryption and decryption, passing unencrypted traffic to your application servers on the secure internal network. This offloads work from your application servers.
- Caching: The reverse proxy can cache frequently requested content, serving it directly without bothering the application servers. If a thousand users request the same image, the reverse proxy fetches it once from the application and then serves it from cache to the other 999 users.
- Compression: The reverse proxy can compress responses before sending them to users, reducing bandwidth usage and speeding up load times.
- Security: Acting as a barrier between the internet and your application, the reverse proxy can filter malicious requests, prevent DDoS attacks, and hide details about your internal infrastructure.
Together, load balancers and reverse proxies ensure that your application can handle traffic spikes gracefully, maintain high availability even when individual servers fail, and deliver fast, reliable performance to users around the world.
Database and External Storage: Keeping Your Data Safe and Accessible
Every application needs to store data, whether it's user accounts, content, transactions, or any other information. In production environments, how you handle data storage is critical for both performance and reliability.
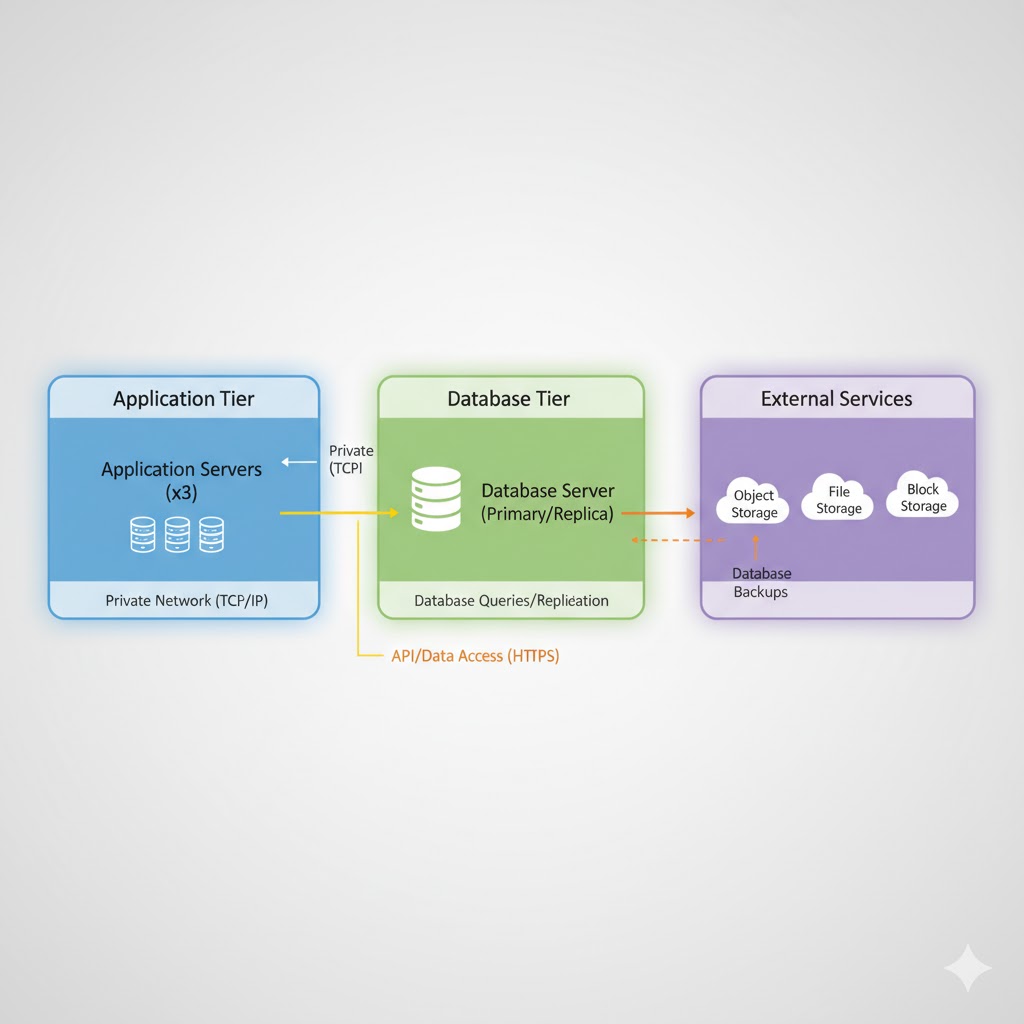
Separating Storage from Application Servers: One of the fundamental principles of production architecture is that your database should not run on the same server as your application. Why? Several important reasons:
Resource Isolation: Databases can be resource-intensive, especially when handling complex queries or large amounts of data. If your database and application compete for the same CPU, memory, and disk resources, both will suffer. By separating them, each can be optimized for its specific workload.
Scalability: You might need to scale your application servers and database servers differently. Maybe you need more application servers to handle user requests, but your database is fine. Or perhaps your database needs more powerful hardware, but your application servers are adequate. Separation allows independent scaling.
Security: Databases contain sensitive information. By placing them on separate servers and connecting them over a private network, you add an extra layer of security. Even if someone compromises an application server, they don't automatically have direct access to the database.
Backup and Recovery: It's easier to implement robust backup strategies when your database is isolated. You can take snapshots, set up replication, and perform maintenance without affecting your application servers.
How the Connection Works: Your application servers connect to the database server over the network. In production, this is typically over a private network that's not accessible from the internet. The application makes database queries just as it would if the database were local, but the actual data lives on the dedicated database server.
For high-traffic applications, you might even have multiple database servers. A common pattern is to have one primary (master) database that handles all write operations and multiple read replicas that handle read operations. Since most applications read data far more often than they write it, this distribution significantly improves performance.
External Storage Services: Beyond databases, applications often need to store files like images, videos, documents, or backups. Rather than storing these on application servers, production applications typically use external storage services like Amazon S3, Google Cloud Storage, or Azure Blob Storage.
These services offer virtually unlimited storage, high durability (your files won't be lost), and fast access from anywhere. When a user uploads a profile picture, for example, your application saves it to external storage and stores just the reference URL in your database.
Service Communication: When Your App Talks to Other Apps
Modern applications rarely work in isolation. They communicate with other services, both internal and external, to accomplish their tasks. This is often called a "microservices architecture" or "service-oriented architecture."
Why Multiple Services?: Instead of building one giant application that does everything, many production systems are broken down into multiple smaller services, each responsible for a specific function. For example:
- An authentication service handles user login and security
- A payment service processes transactions
- A notification service sends emails and push notifications
- A recommendation service suggests content to users
- An analytics service tracks user behavior
Benefits of This Approach: Each service can be developed, deployed, and scaled independently. If your payment service needs to be updated, you can deploy changes without touching the authentication service. If your notification service needs more resources during peak hours, you can scale just that service.
Different services can even use different technologies. Your main application might be written in Node.js, your recommendation engine in Python (for machine learning libraries), and your analytics service in Java. Each team chooses the best tool for their specific problem.
How Services Communicate: Services typically communicate over the network using APIs (Application Programming Interfaces). This might be through REST APIs (using HTTP requests), GraphQL, message queues, or other protocols.
For example, when a user makes a purchase, your main application might:
- Call the payment service to process the credit card
- Call the inventory service to update stock levels
- Call the notification service to send a confirmation email
- Call the analytics service to record the transaction
Each of these is a separate service, potentially running on different servers, but they all work together to complete the purchase.
External Services: Your application might also communicate with third-party services outside your organization. This could include:
- Payment processors like Stripe or PayPal
- Email services like SendGrid or Mailgun
- SMS services like Twilio
- Social media APIs for authentication or sharing
- Cloud services for various features
This distributed architecture makes applications more flexible and resilient, though it also adds complexity. This is why the monitoring and logging systems we'll discuss next are so crucial.
Logging and Monitoring: Keeping Watch Over Your Application
Imagine driving a car with no dashboard. No speedometer, no fuel gauge, no warning lights. You'd have no idea how fast you're going, when you need gas, or if something is wrong with the engine. That's what running a production application without proper logging and monitoring is like.
When your application is running in production with real users, you need visibility into what's happening. Logging and monitoring systems are your eyes and ears, constantly watching every interaction and keeping detailed records of everything that occurs.
What is Logging?: Logging is the practice of recording events that happen in your application. Every time something significant occurs, your application writes a log entry with details about what happened, when it happened, and any relevant context.
Logs capture many types of events:
- Informational logs: Normal operations like "User John logged in" or "Payment processed successfully"
- Warning logs: Concerning situations that aren't errors but merit attention, like "Database query took 5 seconds (normally takes 0.5 seconds)"
- Error logs: When something goes wrong, like "Failed to connect to payment service" or "Database query failed"
- Debug logs: Detailed technical information useful for troubleshooting
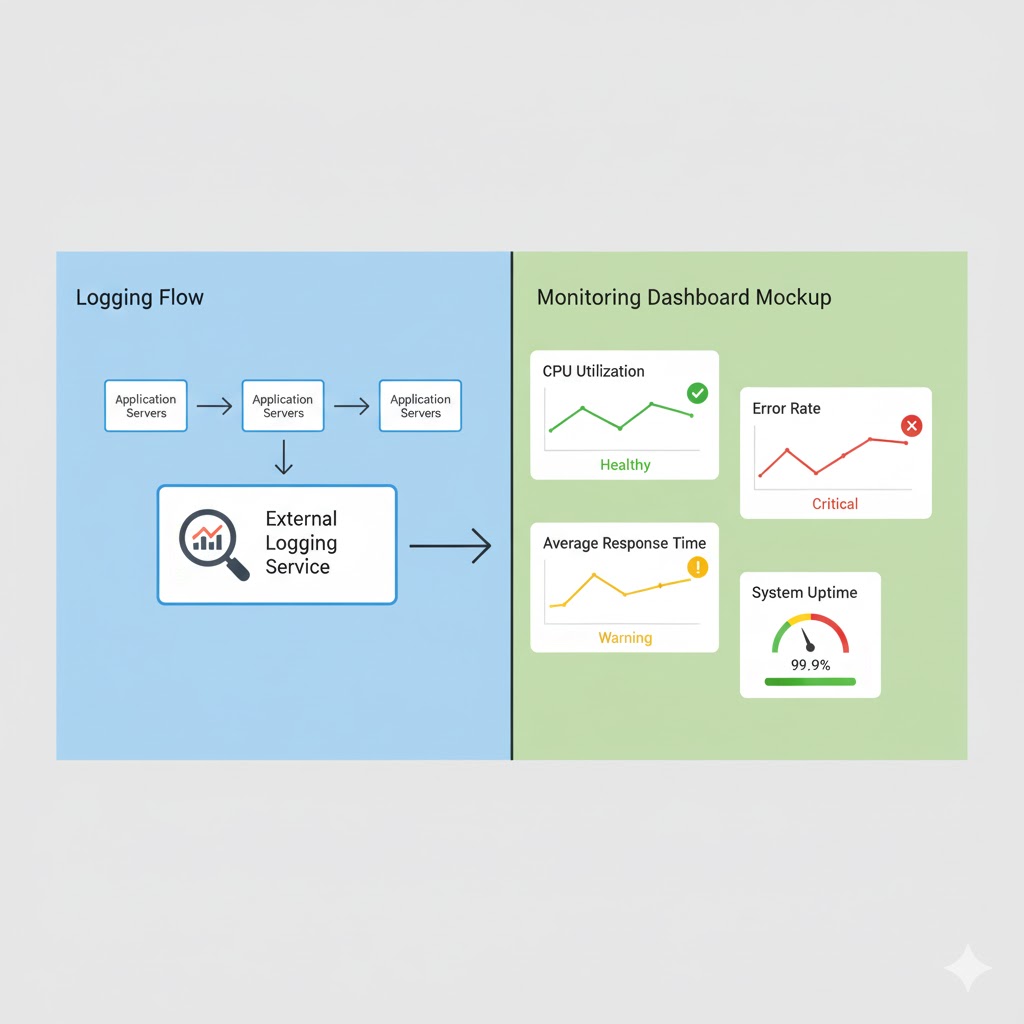
Why Store Logs Externally?: It's standard practice to send logs to external logging services rather than keeping them on your production servers. There are several good reasons for this:
Persistence: If a server crashes, logs stored on that server might be lost. External logging services ensure logs are preserved even if servers fail.
Centralization: When you have multiple servers, each generates its own logs. External logging services collect logs from all servers in one place, making it much easier to search and analyze them.
Storage Space: Logs can accumulate quickly, potentially filling up disk space on your application servers. External services handle storage and can keep logs for extended periods.
Security: If your server is compromised, an attacker might try to delete logs to hide their tracks. Logs stored externally are protected from this tampering.
Analysis Tools: External logging services provide powerful tools for searching, filtering, and analyzing logs that would be difficult to build yourself.
Logging Tools and Platforms: For backend applications, tools like PM2 (for Node.js applications) can capture and manage logs. PM2 not only runs your application but also collects logs, restarts your app if it crashes, and provides monitoring capabilities.
For more comprehensive logging across your entire infrastructure, platforms like ELK Stack (Elasticsearch, Logstash, Kibana), Splunk, or cloud-based solutions like AWS CloudWatch or Google Cloud Logging are commonly used. These systems can ingest logs from multiple sources, index them for fast searching, and provide dashboards for visualization.
Frontend Logging and Error Tracking: Backend logging captures what happens on your servers, but what about errors that occur in users' browsers? This is where frontend error tracking comes in.
Services like Sentry specialize in capturing and reporting errors that happen in the user's browser or mobile app. When a JavaScript error occurs, Sentry captures:
- The exact error message and stack trace
- The user's browser and operating system
- What the user was doing when the error occurred
- The state of the application at the time of the error
This information is invaluable for debugging issues that only occur in specific browsers or situations you didn't test during development. Sentry and similar tools (like Rollbar, Bugsnag, or LogRocket) help developers quickly identify, prioritize, and fix errors affecting real users.
What is Monitoring?: While logging records specific events, monitoring tracks overall system health and performance over time. Monitoring systems continuously collect metrics like:
- Server metrics: CPU usage, memory consumption, disk space, network traffic
- Application metrics: Request rates, response times, error rates, active users
- Database metrics: Query performance, connection pool usage, slow queries
- Business metrics: Transactions per hour, user signups, revenue
These metrics help you understand how your system is performing and identify trends. Is memory usage slowly increasing over time (indicating a memory leak)? Are response times getting slower during certain hours? Is error rate higher on weekends?
The Power of Real-Time Monitoring: Good monitoring systems provide real-time visibility. You can see current metrics on dashboards that update every few seconds. This allows you to spot problems as they develop rather than discovering them hours later in logs.
Monitoring also enables proactive alerting, which brings us to our next crucial component.
Alerting: Getting Notified When Things Go Wrong
Logging and monitoring generate enormous amounts of information, but someone needs to actually watch it and respond when problems occur. That's where alerting systems come in. They automatically detect issues and notify the right people immediately.
How Alerting Works: You configure alerting rules based on your monitoring data and logs. These rules define what constitutes a problem that needs human attention. For example:
- If error rate exceeds 5% for more than 5 minutes, send an alert
- If server CPU usage stays above 90% for 10 minutes, send an alert
- If database connection pool is exhausted, send an alert immediately
- If payment service stops responding, send an alert
- If any server becomes unreachable, send an alert
When one of these conditions is met, the alerting system springs into action.
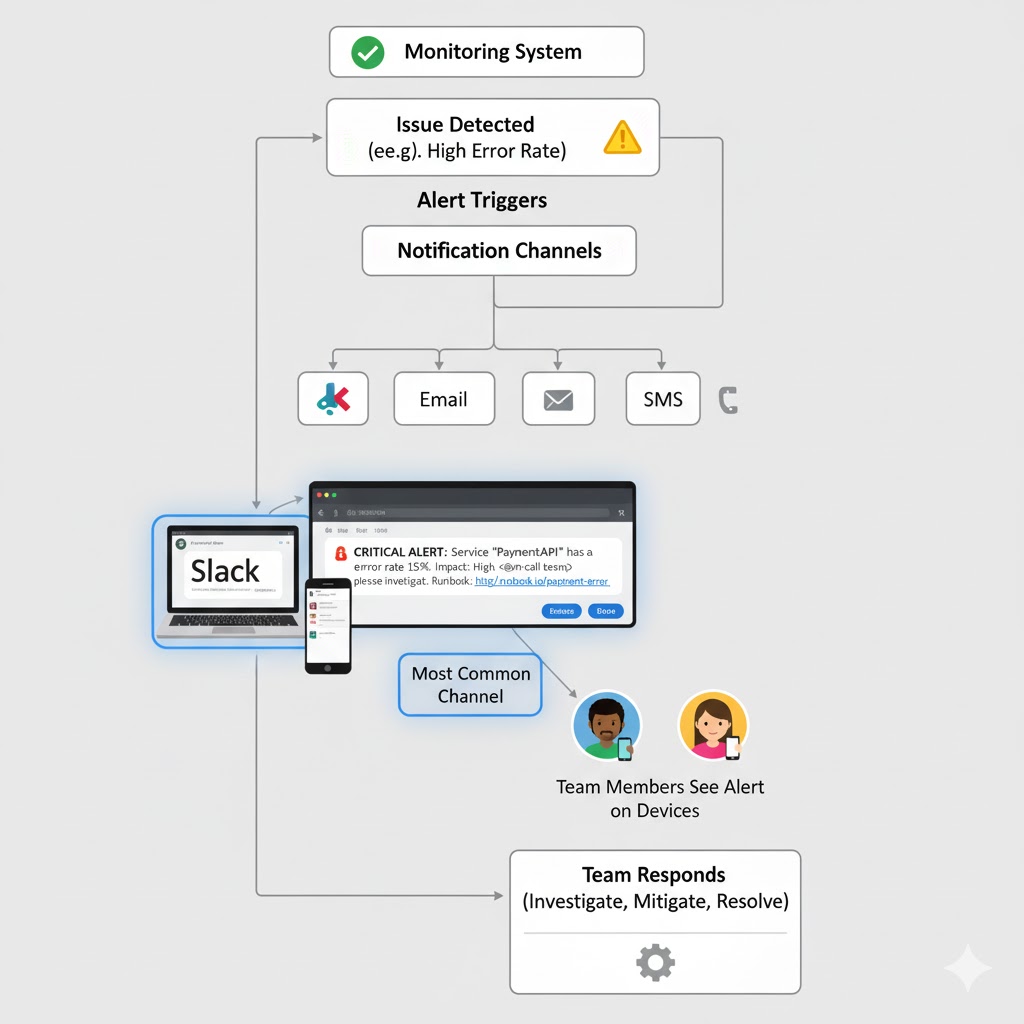
Types of Alerts: Alerts can be delivered through various channels depending on urgency and team preferences:
Push Notifications: For critical issues, teams might configure mobile push notifications so developers are alerted even if they're not at their computer.
Email: For less urgent issues, email alerts provide a record and allow team members to respond when convenient.
SMS: For critical systems that require immediate response, SMS alerts ensure the message gets through even if internet is unavailable.
Slack Integration: Modern practice increasingly favors integrating alerts directly into communication platforms teams already use. Slack has become particularly popular for this purpose.
Why Slack for Alerts?: Imagine having a dedicated Slack channel called #production-alerts where every issue notification appears the moment it's detected. This approach has several advantages:
Visibility: Everyone on the team can see alerts immediately. No one needs to be explicitly notified; if you're in the channel, you see the alert.
Context: Team members can discuss the issue right in the thread below the alert, sharing debugging findings and coordinating the response.
History: The channel provides a searchable history of all alerts, making it easy to identify patterns or recurring issues.
Integration: Slack bots can provide additional context, like linking directly to relevant logs or monitoring dashboards, or even showing graphs of metrics right in the chat.
Acknowledgment: Team members can use reactions (like emoji) to indicate they're investigating an issue, so others know it's being handled.
When an alert comes through Slack, developers can jump into action almost instantly. Instead of waiting for someone to check their email or notice a problem in a dashboard, the alert actively interrupts their attention exactly when intervention is needed.
Alert Fatigue: One challenge with alerting is avoiding "alert fatigue." If you configure too many alerts or set thresholds too sensitive, you'll get constant notifications for minor issues. Team members start ignoring alerts, and then when a real critical issue occurs, the alert might be overlooked.
Good alerting strategy focuses on:
- Alerting only for issues that require human intervention
- Setting appropriate thresholds that filter out normal fluctuations
- Categorizing alerts by severity (critical, warning, informational)
- Regularly reviewing and tuning alert rules based on experience
From Alert to Action: When an alert fires, it typically includes key information to help responders:
- What went wrong (high error rate, service down, etc.)
- When it started
- What service or component is affected
- Links to relevant logs and monitoring dashboards
- Suggested troubleshooting steps (for known issues)
This allows developers to quickly assess the situation and begin debugging, which brings us to the final piece of the puzzle.
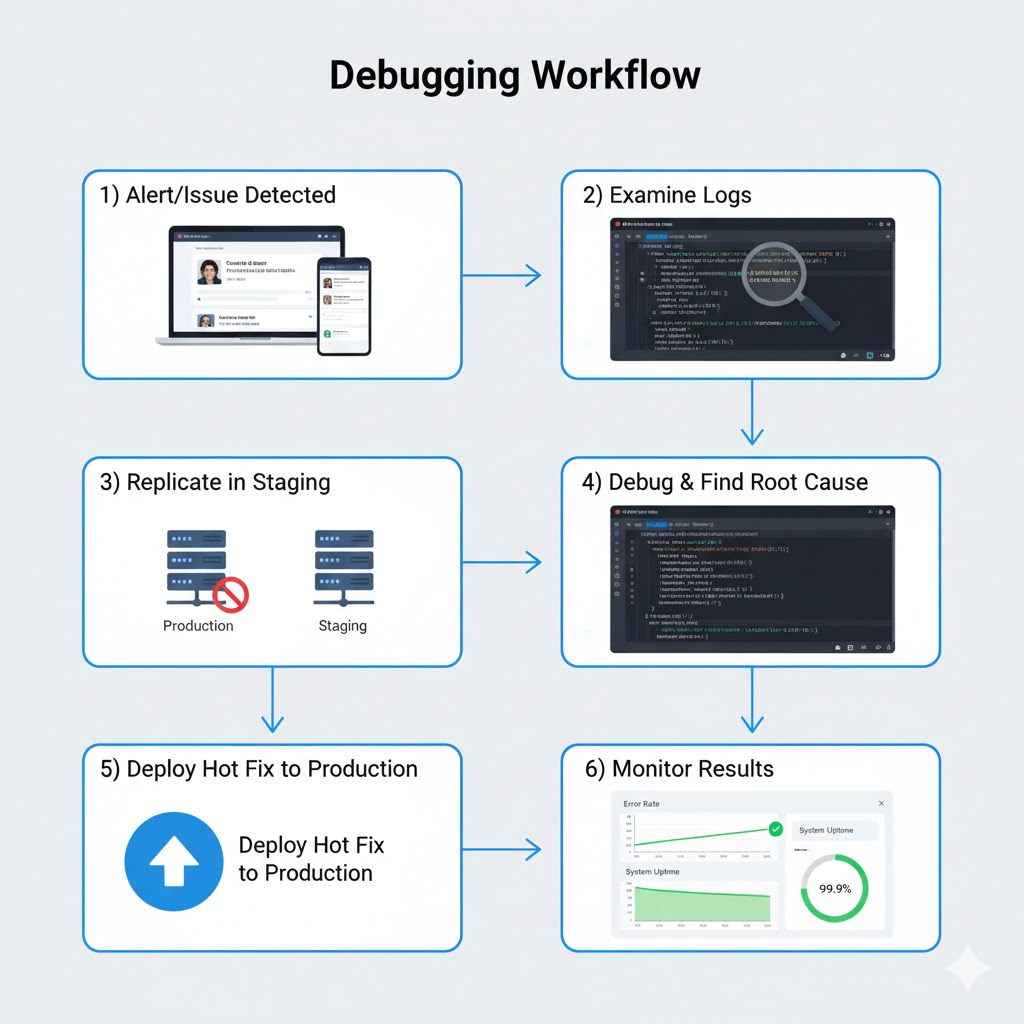
Debugging Production Issues: When Things Go Wrong
Despite all your preventive measures, issues will still occur in production. A third-party API might go down, an edge case you didn't anticipate might trigger a bug, or a server might fail. When this happens, teams need a systematic approach to debugging and resolving the issue as quickly as possible.
Step 1: Identify the Issue: The first step is understanding exactly what's wrong. Those logs we talked about earlier? This is where they become invaluable. Developers start by examining logs around the time the issue occurred, searching for patterns or anomalies.
The alerting system typically provides a starting point, like "Error rate spiked at 3:47 PM." Developers then look at logs from that time period across all relevant servers. They're searching for error messages, unusual patterns, or anything that looks out of place.
Modern logging platforms make this easier by allowing you to filter and search logs across your entire infrastructure. You might search for all error-level logs from the payment service in the last hour, or look for all requests from a specific user who reported a problem.
Monitoring dashboards also help identify issues. Looking at graphs of key metrics, you might notice that error rate increased right after response time spiked, suggesting the slow responses are causing timeout errors. Or you might see that problems started right after a deployment, strongly suggesting the new code introduced a bug.
Step 2: Replicate in a Safe Environment: Once you understand the issue, the next step is reproducing it. But here's the golden rule: never debug directly in production.
Your production environment is serving real users with real data. Experimenting with fixes directly in production risks making things worse, potentially affecting even more users or causing data corruption. Additionally, debugging tools that let you pause execution and inspect variables would freeze your live application, causing outages.
Instead, developers recreate the issue in a staging or test environment. Staging is a copy of your production environment that's isolated from real users but mirrors production as closely as possible. It uses the same versions of code, libraries, and configurations. This allows developers to safely experiment without risking user impact.
Sometimes issues are difficult to reproduce because they depend on specific conditions, like high load or certain data patterns. In these cases, developers might copy sanitized production data to staging or use load testing tools to simulate production traffic levels.
Step 3: Debug and Find the Root Cause: With the issue reproduced in staging, developers can now use debugging tools to peer into what's happening inside the application. This might involve:
Adding More Logging: Sometimes the existing logs don't capture enough detail. Developers might add additional logging statements in the code to track variable values, execution paths, or timing information.
Using Debuggers: Development tools allow developers to pause code execution at specific points (breakpoints), examine variable values, and step through code line by line to see exactly what's happening.
Profiling Tools: For performance issues, profiling tools show where the application spends most of its time, helping identify bottlenecks.
Database Query Analysis: If the issue involves database performance, tools can show exactly what queries are running, how long they take, and whether they're using indexes efficiently.
The goal is to understand not just what's failing, but why. Is it a logic error in the code? A bad interaction between services? A resource constraint? An external dependency timing out? Understanding the root cause ensures the fix actually solves the problem rather than just masking symptoms.
Step 4: Implement and Test the Fix: Once the root cause is identified, developers implement a fix. This might be correcting a logic error, adding error handling, optimizing a slow query, or adjusting configuration.
The fix is then tested thoroughly in the staging environment to ensure:
- It actually resolves the issue
- It doesn't introduce new problems
- It handles edge cases properly
- Performance is acceptable
Step 5: Deploy the Hot Fix: With the fix tested and verified, it's time to deploy to production. For critical issues affecting users right now, teams deploy a "hot fix," which is a rapid deployment of just the essential fix without waiting for the normal release cycle.
The CI/CD pipeline facilitates this, allowing the hot fix to go through automated testing and deployment quickly. Even under pressure, the code still goes through the pipeline to catch any obvious problems before it reaches production.
Post-Deployment Monitoring: After deploying the fix, teams closely monitor the application to ensure the issue is truly resolved. They watch for:
- The error rate returning to normal levels
- User reports of issues stopping
- No new errors introduced by the fix
- Performance metrics remaining healthy
If the fix doesn't work or causes new problems, teams can quickly roll back to the previous version while they work on a better solution.
Step 6: Post-Mortem and Prevention: Once the immediate crisis is over, good teams conduct a post-mortem analysis. This isn't about blaming anyone, but about learning from the incident to prevent similar issues in the future. The team discusses:
- What happened and why
- How it was detected and resolved
- What could have prevented it
- What could have been handled better
- What improvements to make going forward
This might result in new monitoring rules, additional tests, code improvements, documentation updates, or architectural changes to make the system more robust.
Bringing It All Together: The Complete Production Architecture
Let's step back and see how all these components work together in a real production environment. Understanding each piece individually is important, but seeing them work as a cohesive system shows the true power of modern production architecture.
A Day in the Life of a Production System: Imagine a user opens your application. Here's the journey their request takes and how all these systems work together:
- The user's request hits your load balancer (like Nginx), which selects one of your application servers using its distribution algorithm.
- The application server processes the request. As it does, it generates log entries: "User ID 12345 requested dashboard page at 10:23:47 AM." These logs are immediately sent to your external logging service.
- The application needs data, so it queries your database server over the private network. The database returns the results. Monitoring systems track this query's response time (45ms, well within normal range).
- The application might call other services: Perhaps the notification service to check for new messages, or the analytics service to record the page view. Each service call is logged and monitored.
- The application constructs a response and sends it back through the load balancer to the user. The entire request took 180ms, which monitoring systems record as a successful request with good performance.
- Behind the scenes, monitoring systems continuously track metrics: server CPU usage (65%), memory consumption (4.2GB of 8GB), active database connections (23 of 100), and error rate (0.02%, very healthy). All these metrics are normal, so no alerts fire.
When Something Goes Wrong: Now imagine something breaks. A third-party payment API your application uses suddenly starts timing out.
- Within seconds, your monitoring system notices error rates spiking from the normal 0.02% to 15%. This exceeds the configured threshold.
- An alert immediately fires, posting a message to your #production-alerts Slack channel: "CRITICAL: Error rate at 15% for payment service. Payment API timeouts detected."
- Multiple developers see the alert instantly. One responds: "On it!" and begins investigating.
- The developer opens your logging dashboard and searches for recent errors in the payment service. They immediately see dozens of "Connection timeout to payment-api.thirdparty.com" errors.
- The developer checks the third-party API's status page and sees they're experiencing an outage. This is an external issue outside your control.
- As a temporary fix, the developer deploys a hot fix that catches these timeout errors gracefully, shows users a friendly "Payment temporarily unavailable" message, and queues transactions to retry automatically when the service recovers. This goes through your CI/CD pipeline and deploys to production within minutes.
- Error rate drops immediately as the graceful error handling prevents crashes. Users now see a clear message instead of a broken page. Monitoring confirms the fix worked.
- Later that day, when the third-party API recovers, your system automatically processes the queued transactions. The developer writes a post-mortem documenting the incident and suggesting improvements like adding a backup payment processor.
The Continuous Cycle: Even when everything is working perfectly, these systems are constantly at work:
- Developers push code changes multiple times per day. Each change goes through the CI/CD pipeline, getting tested and deployed automatically.
- Logs accumulate continuously, creating a detailed record of everything happening across your infrastructure.
- Monitoring systems collect metrics every few seconds, building up historical data that shows trends and patterns.
- Load balancers adjust dynamically to traffic patterns, distributing load efficiently as user activity rises and falls throughout the day.
- Automated alerts watch for any sign of trouble, ready to notify the team the instant something requires attention.
This is what a mature production architecture looks like: multiple layers of automation, monitoring, and safety systems working together to keep your application running smoothly and your users happy.
Why This Architecture Matters
You might be wondering: "Isn't this all a bit excessive? Do I really need all of this?"
For a small personal project or prototype, probably not. But as your application grows and real users depend on it, these practices shift from "nice to have" to "absolutely essential."
Reliability: Users expect applications to just work. When Facebook or Gmail has downtime, it makes the news because it's so rare. These services achieve that reliability through architectures like we've described.
Scalability: As your user base grows, you can't just keep making your single server more powerful. Load balancing and service-oriented architecture allow you to scale horizontally by adding more servers.
Speed: Users won't tolerate slow applications. Load balancing, caching, and optimized architectures keep your application responsive even under heavy load.
Debuggability: When problems occur (and they will), comprehensive logging and monitoring are the difference between quickly fixing issues and spending days trying to figure out what went wrong.
Team Efficiency: CI/CD pipelines eliminate tedious manual deployment work, allowing developers to focus on writing code. Automated testing catches bugs early when they're easy to fix.
Business Continuity: For businesses that depend on their applications, downtime directly translates to lost revenue and customer trust. Production ready architecture minimizes downtime and enables rapid recovery when issues occur.
Professional Standards: If you're building applications professionally, whether at a startup or large corporation, this architecture represents industry best practices. Understanding these concepts makes you a more valuable developer and enables you to build better systems.
Starting Your Production Journey
If you're new to production architecture, this might seem overwhelming. The good news is you don't have to implement everything at once. Teams typically adopt these practices incrementally:
Start Small: Begin with basic CI/CD to automate deployments. Even simple automated testing and deployment provides immediate value.
Add Monitoring Early: Set up basic logging and monitoring before you have major issues. It's much harder to add these after problems occur.
Grow as Needed: As your application gains users and complexity, add load balancing, improve monitoring, and expand your logging. Let your needs guide what you implement next.
Learn from Others: Study how established companies architect their systems. Many share their practices through engineering blogs and conference talks. You'll find that most successful production systems follow similar patterns to what we've discussed.
Use Managed Services: You don't have to build everything from scratch. Cloud platforms like AWS, Google Cloud, and Azure offer managed services for load balancing, logging, monitoring, and more. These services handle much of the complexity for you, allowing you to focus on your application logic rather than infrastructure management.
Practice Good Habits: Even if you're not running at massive scale, practicing good production habits helps you build better software. Write logs, include error handling, test your code, and monitor your applications. These practices make you a better developer regardless of project size.
The Future of Production Architecture
Production architecture continues to evolve. Here are some trends shaping the future:
Containerization and Orchestration: Technologies like Docker and Kubernetes are changing how applications are deployed and scaled. Containers package applications with all their dependencies, making deployment more consistent. Kubernetes automates the deployment, scaling, and management of containerized applications.
Serverless Architecture: Some applications are moving to serverless models where you don't manage servers at all. You write functions that run on-demand, and the cloud provider handles all the scaling and infrastructure. This can simplify operations but works best for specific types of applications.
Observability: Beyond traditional monitoring, there's a growing focus on "observability," which emphasizes understanding system behavior through comprehensive instrumentation. This includes distributed tracing (tracking requests as they flow through multiple services), structured logging, and advanced analytics.
AI-Assisted Operations: Machine learning is beginning to help with operations tasks like predicting when servers will fail, automatically detecting anomalies in metrics, and even suggesting fixes for common problems.
GitOps: This approach treats infrastructure configuration as code stored in Git repositories. Changes to infrastructure are made through Git commits, providing version control, review processes, and rollback capabilities for infrastructure just like application code.
Despite these new technologies and approaches, the fundamental principles remain constant: automate deployments, distribute load, monitor everything, respond quickly to issues, and always prioritize reliability and user experience.
Common Pitfalls to Avoid
As you implement production architecture, watch out for these common mistakes:
Over-Engineering Early: Don't build for Google-scale if you have 100 users. Start simple and add complexity as needed. Premature optimization wastes time and creates unnecessary complexity.
Under-Monitoring: On the flip side, don't wait until you have problems to add monitoring. By then it's too late. Basic monitoring and logging should be in place from day one.
Ignoring Alerts: If alerts fire frequently for non-issues, tune them better rather than learning to ignore them. Alert fatigue leads to missing real problems.
Testing Only in Development: Your staging environment should closely mirror production. Don't discover environment-specific issues only after deploying to production.
No Rollback Plan: Always have a way to quickly revert to the previous version if a deployment goes wrong. This should be automated and tested.
Neglecting Documentation: Document your architecture, deployment processes, and common troubleshooting steps. When an issue occurs at 2 AM, clear documentation is invaluable.
Single Points of Failure: Identify components that, if they fail, bring down your entire system. Work to eliminate these through redundancy and failover mechanisms.
Skipping Post-Mortems: Every significant incident is a learning opportunity. Take time to analyze what happened and how to prevent it.
Security Considerations
While we've focused on reliability and performance, security is equally crucial in production environments:
Network Security: Use firewalls, private networks, and security groups to control what can communicate with your servers. Your database should never be directly accessible from the internet.
Authentication and Authorization: Implement proper access controls. Use strong authentication for accessing production systems, and limit who can deploy code or access sensitive data.
Encryption: Use HTTPS for all communication with users. Encrypt sensitive data at rest. Use encrypted connections between your services.
Secrets Management: Never hard-code passwords, API keys, or other secrets in your code. Use environment variables or dedicated secrets management services.
Regular Updates: Keep your dependencies, operating systems, and software up to date to patch security vulnerabilities.
Security Monitoring: Monitor for suspicious activity like unusual access patterns, failed login attempts, or unexpected network traffic.
Audit Logs: Maintain detailed logs of who accessed what and when, particularly for sensitive operations. These are crucial for security investigations.
Your logging and monitoring systems play a key role in security by helping detect and respond to security incidents quickly.
Cost Considerations
Production architecture comes with costs, both in terms of infrastructure and engineering time. Here's how to think about the economics:
Infrastructure Costs: Running multiple servers, databases, load balancers, and external services costs money. However, cloud platforms offer pay-as-you-go pricing, so you can start small and scale up as revenue grows.
Efficiency Saves Money: Good architecture can actually reduce costs. Proper caching reduces database load, efficient code uses less CPU, and automated monitoring catches resource leaks before they get expensive.
Downtime is Expensive: Calculate what an hour of downtime costs your business in lost revenue and customer trust. Investing in reliability often pays for itself quickly.
Developer Time: Remember that developer time is expensive. Automation that saves developer hours is usually worth the investment, even if it increases infrastructure costs slightly.
Start-Up Friendly Options: Many providers offer credits or free tiers for startups. GitHub Actions, for example, provides free CI/CD for public repositories. You can start with free or low-cost options and upgrade as you grow.
Real-World Examples
Let's look at how different types of applications apply these principles:
E-Commerce Site: An online store needs high reliability during peak shopping periods. They use load balancing to handle traffic spikes during sales, comprehensive logging to debug payment issues quickly, and monitoring to detect when checkout success rate drops. Their CI/CD pipeline allows them to deploy urgent fixes without manual intervention.
Social Media Platform: A social network has millions of users generating content constantly. They use microservices architecture to scale different features independently, extensive caching to reduce database load, and real-time monitoring to detect issues affecting user experience. Their alerting system immediately notifies teams when posting or login success rates drop.
SaaS Business Application: A business software company prioritizes reliability because their customers depend on the service for daily operations. They use redundant servers across multiple data centers, comprehensive backup systems, and detailed audit logging. Their CI/CD pipeline includes extensive automated testing to catch bugs before they reach customers.
Mobile App Backend: A mobile app's backend needs to handle variable traffic patterns as users are active at different times. They use auto-scaling to add servers during peak hours and reduce them during quiet periods, monitoring to track API performance, and feature flags in their deployment pipeline to gradually roll out new features.
Each of these applications started simpler and evolved their architecture as they grew, demonstrating that production architecture is a journey, not a destination.
Building the Right Team Culture
Technology alone doesn't create great production systems. You also need the right team culture:
Shared Responsibility: Everyone on the team should care about production quality, not just operations or DevOps engineers. Developers should understand how their code runs in production and participate in on-call rotations.
Blameless Post-Mortems: When issues occur, focus on system improvements rather than individual blame. This encourages honesty and learning.
Continuous Improvement: Regularly review your architecture, monitoring, and processes. What worked at 1,000 users might not work at 100,000.
Communication: Keep everyone informed about deployments, incidents, and architectural changes. Good communication prevents surprises and enables collaboration.
Documentation: Maintain up-to-date documentation about your architecture, deployment processes, and common issues. This helps new team members and serves as a reference during incidents.
Automation Culture: Favor automation over manual processes. If you find yourself doing the same task repeatedly, automate it.
Your Path Forward
Building production ready applications is a skill that develops over time. Here are concrete steps you can take:
- Learn by Doing: Set up a simple CI/CD pipeline for a personal project. Deploy it to a cloud provider. Add basic monitoring. Experience these tools firsthand.
- Study Real Systems: Read engineering blogs from companies like Netflix, Spotify, Airbnb, and others. They regularly share how they solve production challenges.
- Experiment Safely: Use staging environments to try new approaches without risking production. Break things intentionally to learn how systems fail and recover.
- Start Simple, Iterate: Don't try to implement everything at once. Start with CI/CD and basic monitoring, then gradually add more sophisticated practices.
- Monitor Your Metrics: Even simple applications benefit from basic metrics. Track response times, error rates, and resource usage from day one.
- Prepare for Failure: Assume things will go wrong and plan accordingly. Have runbooks for common issues. Practice your incident response.
- Stay Current: Production best practices evolve. Follow industry blogs, attend conferences (even virtually), and learn from others' experiences.
Remember, every successful production system was built incrementally. The massive, sophisticated architectures you hear about didn't appear overnight. They evolved through years of iteration, learning from failures, and continuous improvement.
Closing Thoughts
Production architecture might seem complex, but at its heart, it's about creating systems that are reliable, scalable, and maintainable. Every component we've discussed serves a specific purpose in achieving these goals.
CI/CD pipelines ensure code gets from development to production safely and automatically. Load balancers distribute traffic so no single server becomes overwhelmed. Logging captures a detailed record of everything that happens. Monitoring provides visibility into system health. Alerting notifies teams when intervention is needed. And structured debugging processes ensure issues get resolved quickly and thoroughly.
These aren't just technical tools; they're the foundation of applications that people can depend on. Whether you're building the next great startup or working on enterprise systems, understanding production architecture makes you a more capable developer and enables you to create better software.
The journey from "it works on my machine" to "it works reliably for millions of users" is challenging but incredibly rewarding. Each layer of sophistication you add makes your application more robust, your team more effective, and your users happier.
Start where you are, use what you have, and build incrementally. Every step you take toward better production practices is an investment in the quality and reliability of your applications. Your future self, your team, and your users will thank you.